Update
Hello all,
Just wanted to update everyone that in regards to the virus and all, Eastgate is closed to the Public until further notice.
Thank you
Mall Management
![]()
![]()


Chattanooga is the fastest growing city in Tennessee.
Commercial Growth
Chattanooga is the place for Pioneers.
Fastest Internet In The Country
Hello all,
Just wanted to update everyone that in regards to the virus and all, Eastgate is closed to the Public until further notice.
Thank you
Mall Management
We have finished with the upgrading of the parking lot lights. We hope that everyone enjoys the new lighting.
As always if you ever need security please call them at 423-710-0849 and a officer will assist you.
Thank you
| Population | 1-mi. | 3-mi. | 5-mi. |
|---|---|---|---|
| 2013 Male Population | 1,578 | 25,018 | 66,213 |
| 2013 Female Population | 1,746 | 27,949 | 73,846 |
| % 2013 Male Population | 47.47% | 47.23% | 47.28% |
| % 2013 Female Population | 52.53% | 52.77% | 52.72% |
| 2013 Total Population: Adult | 2,488 | 41,688 | 108,608 |
| 2013 Total Daytime Population | 5,730 | 56,560 | 191,858 |
| 2013 Total Employees | 4,014 | 27,951 | 111,491 |
| 2013 Total Population: Median Age | 34 | 38 | 38 |
| 2013 Total Population: Adult Median Age | 44 | 48 | 48 |
| 2013 Total population: Under 5 years | 249 | 3,465 | 9,575 |
| 2013 Total population: 5 to 9 years | 218 | 2,979 | 8,489 |
| 2013 Total population: 10 to 14 years | 229 | 2,916 | 8,174 |
| 2013 Total population: 15 to 19 years | 219 | 3,185 | 8,960 |
| 2013 Total population: 20 to 24 years | 253 | 3,907 | 10,677 |
| 2013 Total population: 25 to 29 years | 262 | 4,019 | 10,354 |
| 2013 Total population: 30 to 34 years | 267 | 3,680 | 9,456 |
| 2013 Total population: 35 to 39 years | 255 | 3,375 | 8,667 |
| 2013 Total population: 40 to 44 years | 200 | 3,304 | 8,402 |
| 2013 Total population: 45 to 49 years | 260 | 3,590 | 9,192 |
| 2013 Total population: 50 to 54 years | 234 | 3,789 | 9,732 |
| 2013 Total population: 55 to 59 years | 212 | 3,669 | 9,267 |
| 2013 Total population: 60 to 64 years | 133 | 3,089 | 7,927 |
| 2013 Total population: 65 to 69 years | 110 | 2,302 | 6,145 |
| 2013 Total population: 70 to 74 years | 74 | 1,780 | 4,877 |
| 2013 Total population: 75 to 79 years | 71 | 1,487 | 4,097 |
| 2013 Total population: 80 to 84 years | 38 | 1,235 | 3,147 |
| 2013 Total population: 85 years and over | 40 | 1,196 | 2,921 |
| % 2013 Total population: Under 5 years | 7.49% | 6.54% | 6.84% |
| % 2013 Total population: 5 to 9 years | 6.56% | 5.62% | 6.06% |
| % 2013 Total population: 10 to 14 years | 6.89% | 5.51% | 5.84% |
| % 2013 Total population: 15 to 19 years | 6.59% | 6.01% | 6.40% |
| % 2013 Total population: 20 to 24 years | 7.61% | 7.38% | 7.62% |
| % 2013 Total population: 25 to 29 years | 7.88% | 7.59% | 7.39% |
| % 2013 Total population: 30 to 34 years | 8.03% | 6.95% | 6.75% |
| % 2013 Total population: 35 to 39 years | 7.67% | 6.37% | 6.19% |
| % 2013 Total population: 40 to 44 years | 6.02% | 6.24% | 6.00% |
| % 2013 Total population: 45 to 49 years | 7.82% | 6.78% | 6.56% |
| % 2013 Total population: 50 to 54 years | 7.04% | 7.15% | 6.95% |
| % 2013 Total population: 55 to 59 years | 6.38% | 6.93% | 6.62% |
| % 2013 Total population: 60 to 64 years | 4.00% | 5.83% | 5.66% |
| % 2013 Total population: 65 to 69 years | 3.31% | 4.35% | 4.39% |
| % 2013 Total population: 70 to 74 years | 2.23% | 3.36% | 3.48% |
| % 2013 Total population: 75 to 79 years | 2.14% | 2.81% | 2.93% |
| % 2013 Total population: 80 to 84 years | 1.14% | 2.33% | 2.25% |
| % 2013 Total population: 85 years and over | 1.20% | 2.26% | 2.09% |
| 2013 White alone | 1,427 | 33,717 | 85,360 |
| 2013 Black or African American alone | 1,604 | 15,795 | 44,099 |
| 2013 American Indian and Alaska Native alone | 28 | 218 | 642 |
| 2013 Asian alone | 56 | 797 | 2,445 |
| 2013 Native Hawaiian and OPI alone | 5 | 56 | 188 |
| 2013 Some Other Race alone | 118 | 1,384 | 4,397 |
| 2013 Two or More Races alone | 86 | 1,000 | 2,928 |
| 2013 Hispanic | 331 | 2,916 | 8,498 |
| 2013 Not Hispanic | 2,993 | 50,051 | 131,561 |
| % 2013 White alone | 42.93% | 63.66% | 60.95% |
| % 2013 Black or African American alone | 48.26% | 29.82% | 31.49% |
| % 2013 American Indian and Alaska Native alone | 0.84% | 0.41% | 0.46% |
| % 2013 Asian alone | 1.68% | 1.50% | 1.75% |
| % 2013 Native Hawaiian and OPI alone | 0.15% | 0.11% | 0.13% |
| % 2013 Some Other Race alone | 3.55% | 2.61% | 3.14% |
| % 2013 Two or More Races alone | 2.59% | 1.89% | 2.09% |
| % 2013 Hispanic | 9.96% | 5.51% | 6.07% |
| % 2013 Not Hispanic | 90.04% | 94.49% | 93.93% |
| 2000 Not Hispanic: White alone | 1,525 | 35,067 | 83,646 |
| 2000 Not Hispanic: Black or African American alone | 1,216 | 12,848 | 38,938 |
| 2000 Not Hispanic: American Indian and Alaska Native alone | 9 | 143 | 375 |
| 2000 Not Hispanic: Asian alone | 63 | 721 | 1,769 |
| 2000 Not Hispanic: Native Hawaiian and OPI alone | 1 | 14 | 55 |
| 2000 Not Hispanic: Some Other Race alone | 8 | 64 | 119 |
| 2000 Not Hispanic: Two or More Races | 49 | 539 | 1,397 |
| % 2000 Not Hispanic: White alone | 51.24% | 69.94% | 64.93% |
| % 2000 Not Hispanic: Black or African American alone | 40.86% | 25.63% | 30.22% |
| % 2000 Not Hispanic: American Indian and Alaska Native alone | 0.30% | 0.29% | 0.29% |
| % 2000 Not Hispanic: Asian alone | 2.12% | 1.44% | 1.37% |
| % 2000 Not Hispanic: Native Hawaiian and OPI alone | 0.03% | 0.03% | 0.04% |
| % 2000 Not Hispanic: Some Other Race alone | 0.27% | 0.13% | 0.09% |
| % 2000 Not Hispanic: Two or More Races | 1.65% | 1.08% | 1.08% |
| Population Change | 1-mi. | 3-mi. | 5-mi. |
|---|---|---|---|
| Total: Employees (NAICS) | n/a | n/a | n/a |
| Total: Establishements (NAICS) | n/a | n/a | n/a |
| 2013 Total Population | 3,324 | 52,967 | 140,059 |
| 2013 Households | 1,360 | 22,787 | 58,065 |
| Population Change 2010-2013 | 58 | 1,032 | 2,087 |
| Household Change 2010-2013 | 11 | 167 | 142 |
| % Population Change 2010-2013 | 1.78% | 1.99% | 1.51% |
| % Household Change 2010-2013 | 0.82% | 0.74% | 0.25% |
| Population Change 2000-2013 | 348 | 2,830 | 11,230 |
| Household Change 2000-2013 | 39 | 893 | 4,151 |
| % Population Change 2000 to 2013 | 11.69% | 5.64% | 8.72% |
| % Household Change 2000 to 2013 | 2.95% | 4.08% | 7.70% |
| Housing | 1-mi. | 3-mi. | 5-mi. |
|---|---|---|---|
| 2000 Housing Units | 1,434 | 23,651 | 59,234 |
| 2000 Occupied Housing Units | 1,321 | 21,894 | 53,916 |
| 2000 Owner Occupied Housing Units | 850 | 13,233 | 31,916 |
| 2000 Renter Occupied Housing Units | 471 | 8,661 | 22,000 |
| 2000 Vacant Housings Units | 113 | 1,759 | 5,322 |
| % 2000 Occupied Housing Units | 92.12% | 92.57% | 91.02% |
| % 2000 Owner occupied housing units | 64.35% | 60.44% | 59.20% |
| % 2000 Renter occupied housing units | 35.65% | 39.56% | 40.80% |
| % 2000 Vacant housing units | 7.88% | 7.44% | 8.98% |
| Income | 1-mi. | 3-mi. | 5-mi. |
|---|---|---|---|
| 2013 Household Income: Median | $37,624 | $38,435 | $36,029 |
| 2013 Household Income: Average | $41,241 | $47,934 | $46,976 |
| 2013 Per Capita Income | $16,924 | $20,869 | $19,752 |
| 2013 Household income: Less than $10,000 | 192 | 1,851 | 6,486 |
| 2013 Household income: $10,000 to $14,999 | 106 | 1,628 | 4,506 |
| 2013 Household income: $15,000 to $19,999 | 67 | 1,824 | 4,567 |
| 2013 Household income: $20,000 to $24,999 | 82 | 1,641 | 4,268 |
| 2013 Household income: $25,000 to $29,999 | 150 | 1,819 | 4,532 |
| 2013 Household income: $30,000 to $34,999 | 41 | 1,458 | 3,892 |
| 2013 Household income: $35,000 to $39,999 | 80 | 1,706 | 3,795 |
| 2013 Household income: $40,000 to $44,999 | 93 | 1,138 | 2,548 |
| 2013 Household income: $45,000 to $49,999 | 139 | 1,258 | 2,993 |
| 2013 Household income: $50,000 to $59,999 | 28 | 2,057 | 4,912 |
| 2013 Household income: $60,000 to $74,999 | 234 | 2,366 | 4,952 |
| 2013 Household income: $75,000 to $99,999 | 106 | 2,323 | 5,851 |
| 2013 Household income: $100,000 to $124,999 | 35 | 852 | 2,304 |
| 2013 Household income: $125,000 to $149,999 | n/a | 348 | 1,017 |
| 2013 Household income: $150,000 to $199,999 | 7 | 333 | 758 |
| 2013 Household income: $200,000 or more | n/a | 185 | 684 |
| % 2013 Household income: Less than $10,000 | 14.12% | 8.12% | 11.17% |
| % 2013 Household income: $10,000 to $14,999 | 7.79% | 7.14% | 7.76% |
| % 2013 Household income: $15,000 to $19,999 | 4.93% | 8.00% | 7.87% |
| % 2013 Household income: $20,000 to $24,999 | 6.03% | 7.20% | 7.35% |
| % 2013 Household income: $25,000 to $29,999 | 11.03% | 7.98% | 7.81% |
| % 2013 Household income: $30,000 to $34,999 | 3.01% | 6.40% | 6.70% |
| % 2013 Household income: $35,000 to $39,999 | 5.88% | 7.49% | 6.54% |
| % 2013 Household income: $40,000 to $44,999 | 6.84% | 4.99% | 4.39% |
| % 2013 Household income: $45,000 to $49,999 | 10.22% | 5.52% | 5.15% |
| % 2013 Household income: $50,000 to $59,999 | 2.06% | 9.03% | 8.46% |
| % 2013 Household income: $60,000 to $74,999 | 17.21% | 10.38% | 8.53% |
| % 2013 Household income: $75,000 to $99,999 | 7.79% | 10.19% | 10.08% |
| % 2013 Household income: $100,000 to $124,999 | 2.57% | 3.74% | 3.97% |
| % 2013 Household income: $125,000 to $149,999 | 0.00% | 1.53% | 1.75% |
| % 2013 Household income: $150,000 to $199,999 | 0.51% | 1.46% | 1.31% |
| % 2013 Household income: $200,000 or more | 0.00% | 0.81% | 1.18% |
| Retail Sales Volume | 1-mi. | 3-mi. | 5-mi. |
|---|---|---|---|
| 2013 Childrens/Infants clothing stores | $417,912 | $7,140,838 | $17,380,362 |
| 2013 Jewelry stores | $225,560 | $3,261,884 | $8,398,021 |
| 2013 Mens clothing stores | $771,952 | $6,505,848 | $16,310,282 |
| 2013 Shoe stores | $541,042 | $5,967,898 | $16,405,478 |
| 2013 Womens clothing stores | $890,287 | $10,954,006 | $29,654,442 |
| 2013 Automobile dealers | $4,410,030 | $78,456,364 | $211,738,299 |
| 2013 Automotive parts and accessories stores | $1,055,589 | $19,403,719 | $47,670,094 |
| 2013 Other motor vehicle dealers | $103,915 | $3,902,055 | $8,963,992 |
| 2013 Tire dealers | $457,079 | $8,716,301 | $21,362,099 |
| 2013 Hardware stores | $6,539 | $159,276 | $340,676 |
| 2013 Home centers | $54,454 | $1,283,468 | $3,420,578 |
| 2013 Nursery and garden centers | $84,603 | $1,711,523 | $4,640,089 |
| 2013 Outdoor power equipment stores | $183,924 | $1,685,388 | $4,835,100 |
| 2013 Paint andwallpaper stores | $6,090 | $140,081 | $347,408 |
| 2013 Appliance, television, and other electronics stores | $868,686 | $11,976,161 | $29,856,738 |
| 2013 Camera andphotographic supplies stores | $52,727 | $1,117,817 | $3,040,126 |
| 2013 Computer andsoftware stores | $1,675,190 | $29,610,456 | $73,878,331 |
| 2013 Beer, wine, and liquor stores | $327,947 | $5,010,615 | $12,352,851 |
| 2013 Convenience stores | $1,516,558 | $22,926,338 | $58,919,665 |
| 2013 Restaurant Expenditures | $1,438,250 | $23,778,311 | $58,662,937 |
| 2013 Supermarkets and other grocery (except convenience) stores | $4,429,998 | $83,067,075 | $209,408,750 |
| 2013 Furniture stores | $660,498 | $8,693,913 | $21,731,427 |
| 2013 Home furnishings stores | $1,292,846 | $20,301,416 | $51,044,210 |
| 2013 General merchandise stores | $7,541,702 | $109,033,605 | $275,829,987 |
| 2013 Gasoline stations with convenience stores | $4,234,595 | $70,542,551 | $178,853,597 |
| 2013 Other gasoline stations | $2,908,828 | $50,230,894 | $126,638,322 |
| 2013 Department stores (excl leased depts) | $7,316,141 | $105,771,722 | $267,431,968 |
| 2013 General merchandise stores | $7,541,702 | $109,033,605 | $275,829,987 |
| 2013 Other health and personal care stores | $422,741 | $7,808,578 | $19,497,028 |
| 2013 Pharmacies and drug stores | $1,271,848 | $23,086,814 | $57,463,826 |
| 2013 Pet and pet supplies stores | $328,544 | $6,588,748 | $16,354,237 |
| 2013 Book, periodical, and music stores | $110,625 | $1,888,269 | $4,731,466 |
| 2013 Hobby, toy, and game stores | $147,726 | $1,996,212 | $5,557,201 |
| 2013 Musical instrument and supplies stores | $14,557 | $559,957 | $1,217,487 |
| 2013 Sewing, needlework, and piece goods stores | $96,206 | $762,695 | $2,122,045 |
| 2013 Sporting goods stores | $148,278 | $2,696,701 | $6,168,345 |
Our online maintenance system is easy to use and allows you to track the progress of any issues from initial request to scheduling to completion.
Below are screen shots of our easy to use system:

The initial maintenance screen presents you with two easy options as shown above.
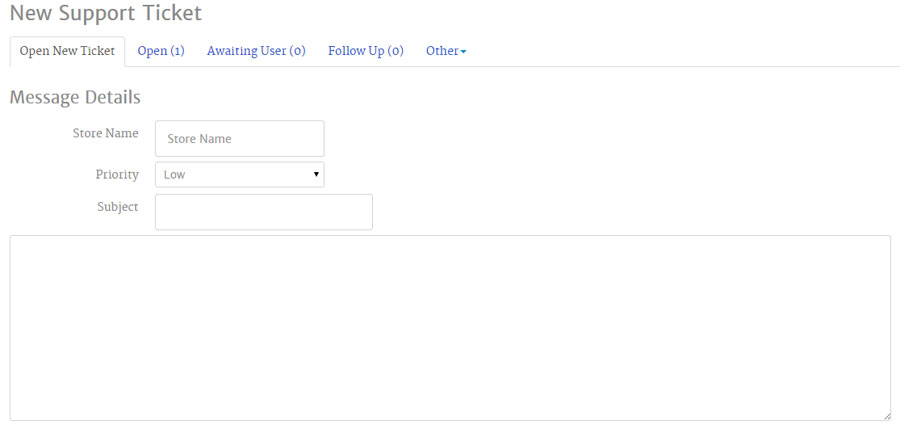
When opening a new ticket, simply feel out the questions as seen above.
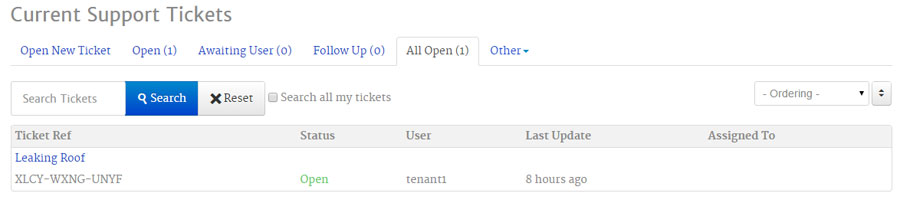
When viewing the status of an existing maintenance request, simply view open tickets as shown above.
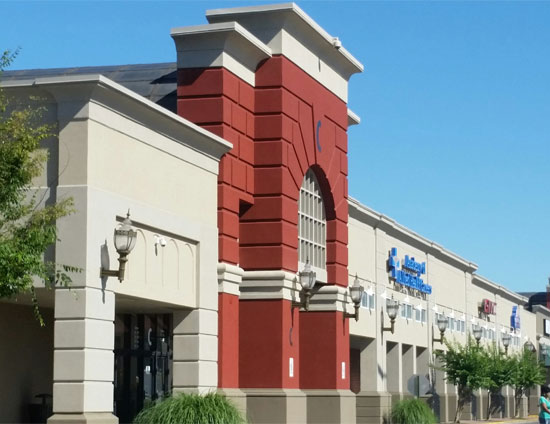
 Eastgate Town Center
Square One Commercial Real Estate
407 East 5th Street, Suite B
Chattanooga, Tennessee 37403
Lease Negotiable
423-551-3279 ![]()
![]()
![]()

Utilizing the latest internet technologies, we provide our tenants with online maintenance submission and tracking. We understand that your facilities are important and our facilities are excellent. Allow us to show you the difference. See how our facilities are right for you.
Contact Us